Five entities, three systems,
one monthly close
A travel and hospitality group carrying $46.4M in assets was closing every month by hand-copying five trial balances into a 33-tab workbook nobody fully understood. I rebuilt it from source. The close now produces a consolidated statement package, feeds the board deck and the liquidity report, and holds up under the annual review.
What it produces
The point was never the workbook. It was a close the group could run, report from, and defend.
The president closes the month himself. He drops in the trial balance files, runs the normalizer, checks the integrity guard, and moves one date cell. Every statement and chart in the workbook re-dates behind it.
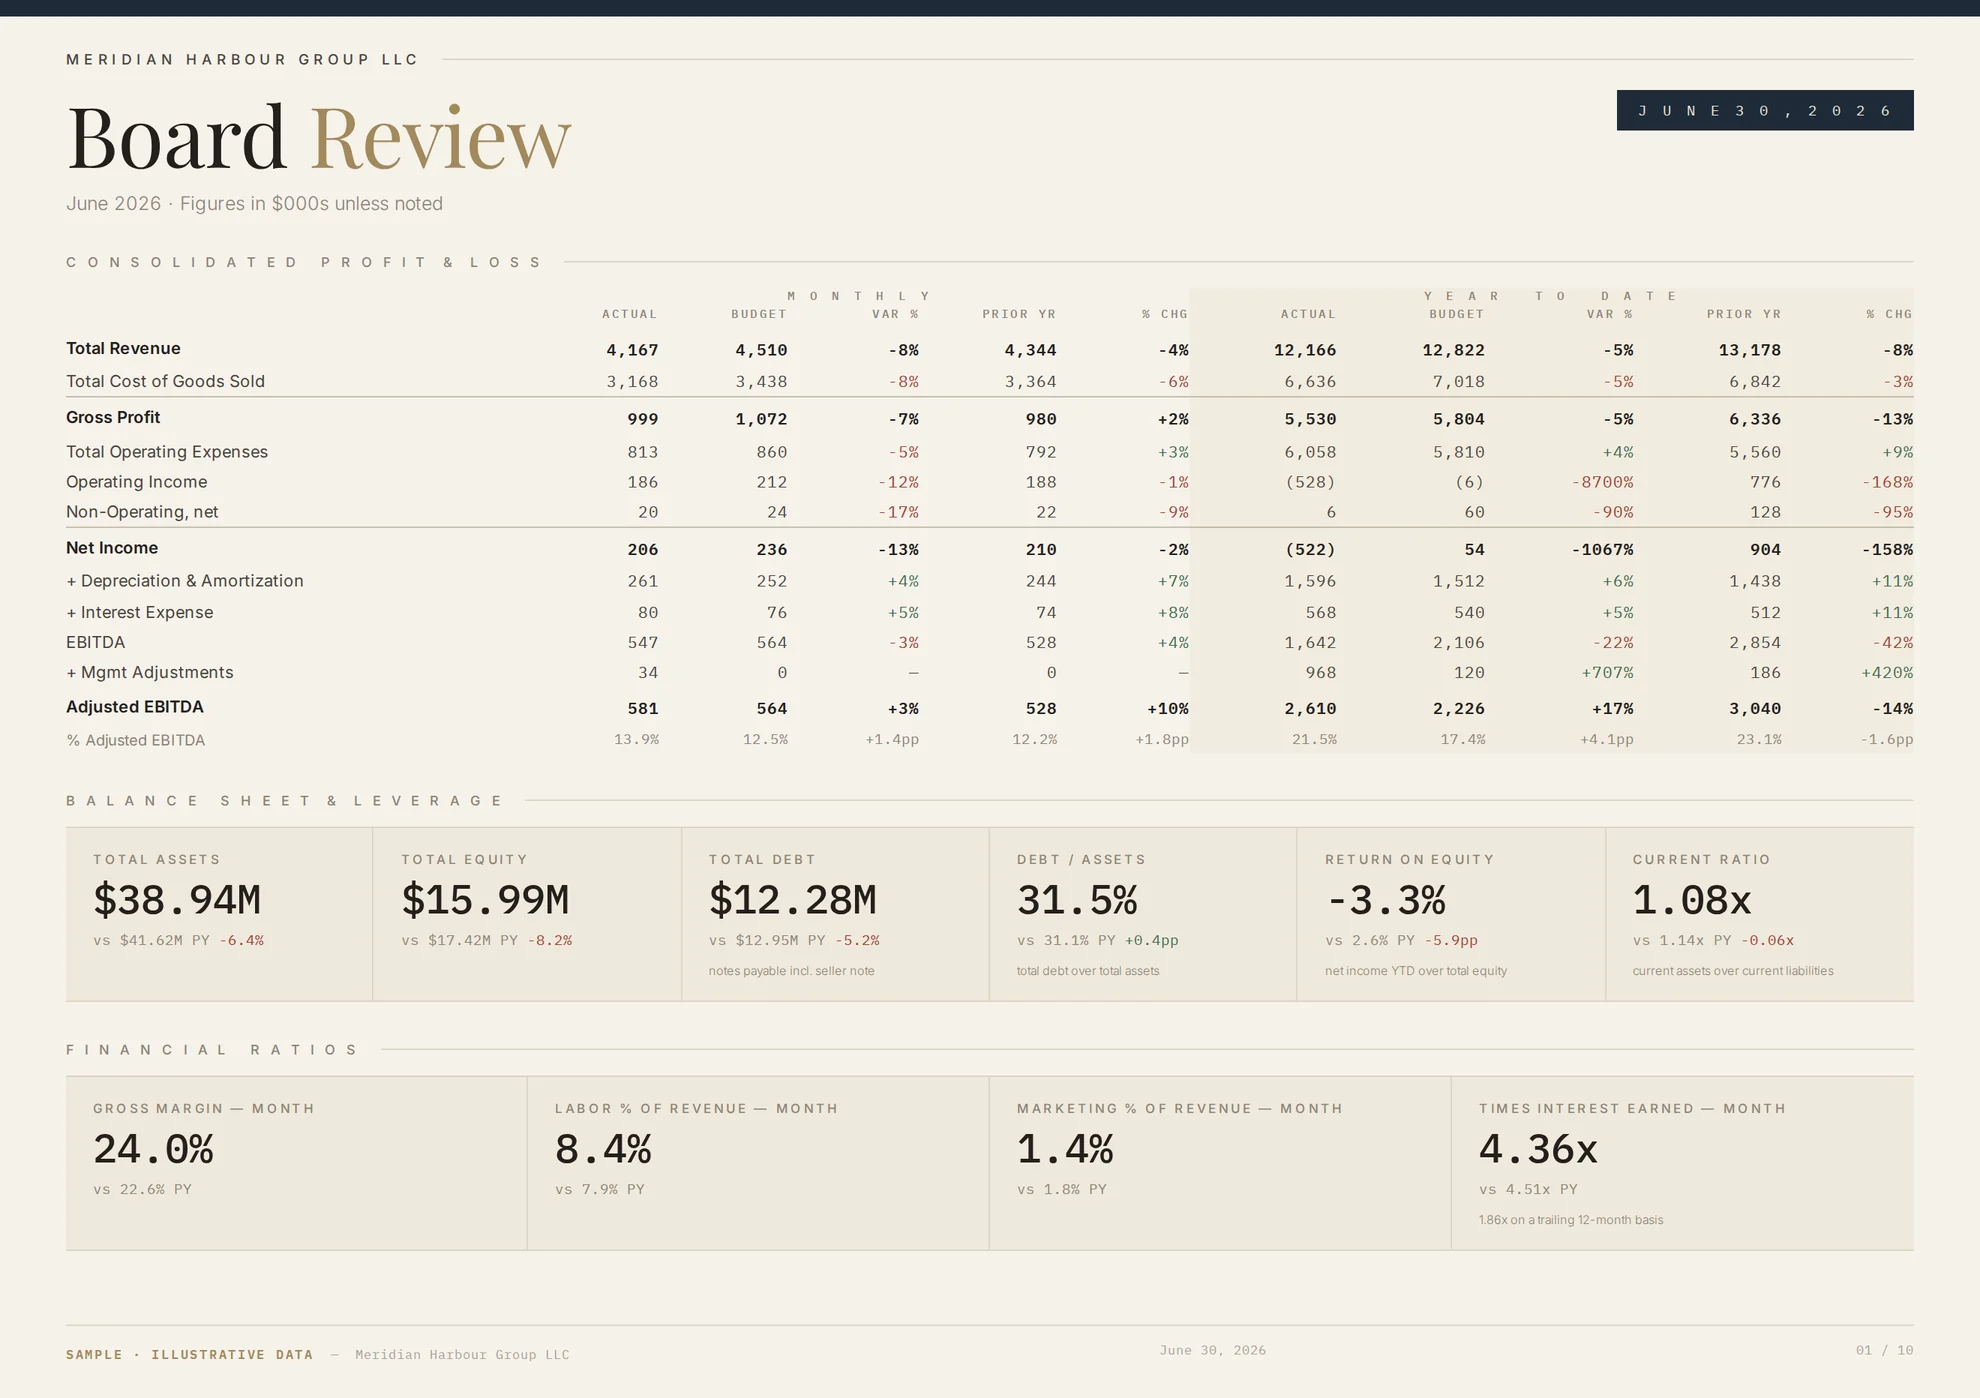
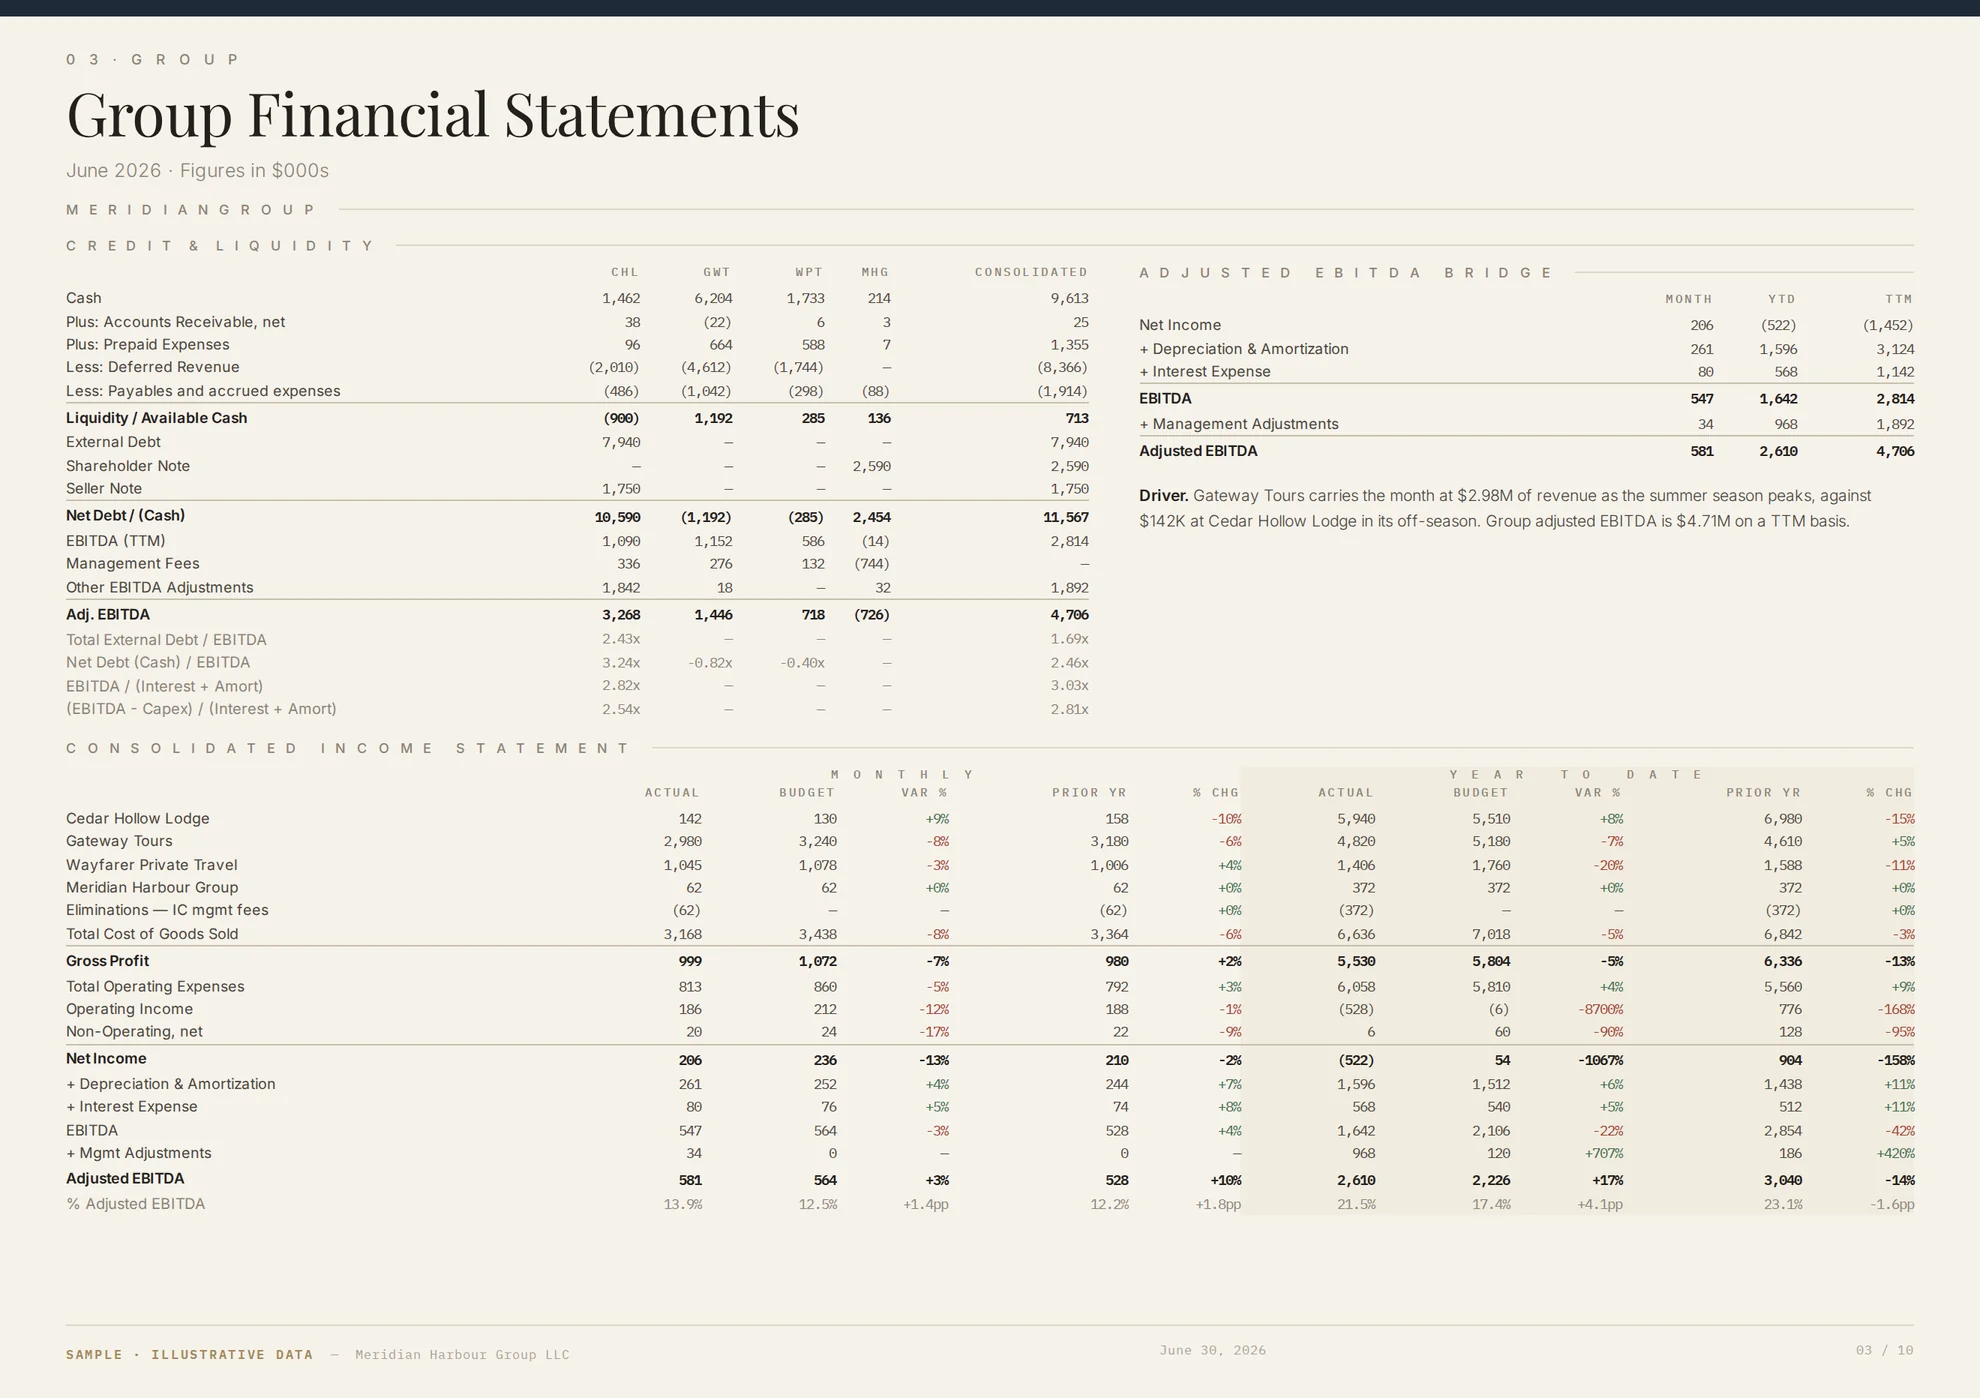
One data layer feeds all of the reporting: the consolidated statement package, the monthly board deck, the liquidity and credit report, and the schedules the outside reviewer asks for each year. When a number is questioned, the answer is a row in a visible table rather than a formula chain nobody wants to open.
Forty months of history sit behind it, so any prior period can be restated without rebuilding anything. Two of the group’s own accountants now work inside the procedure.
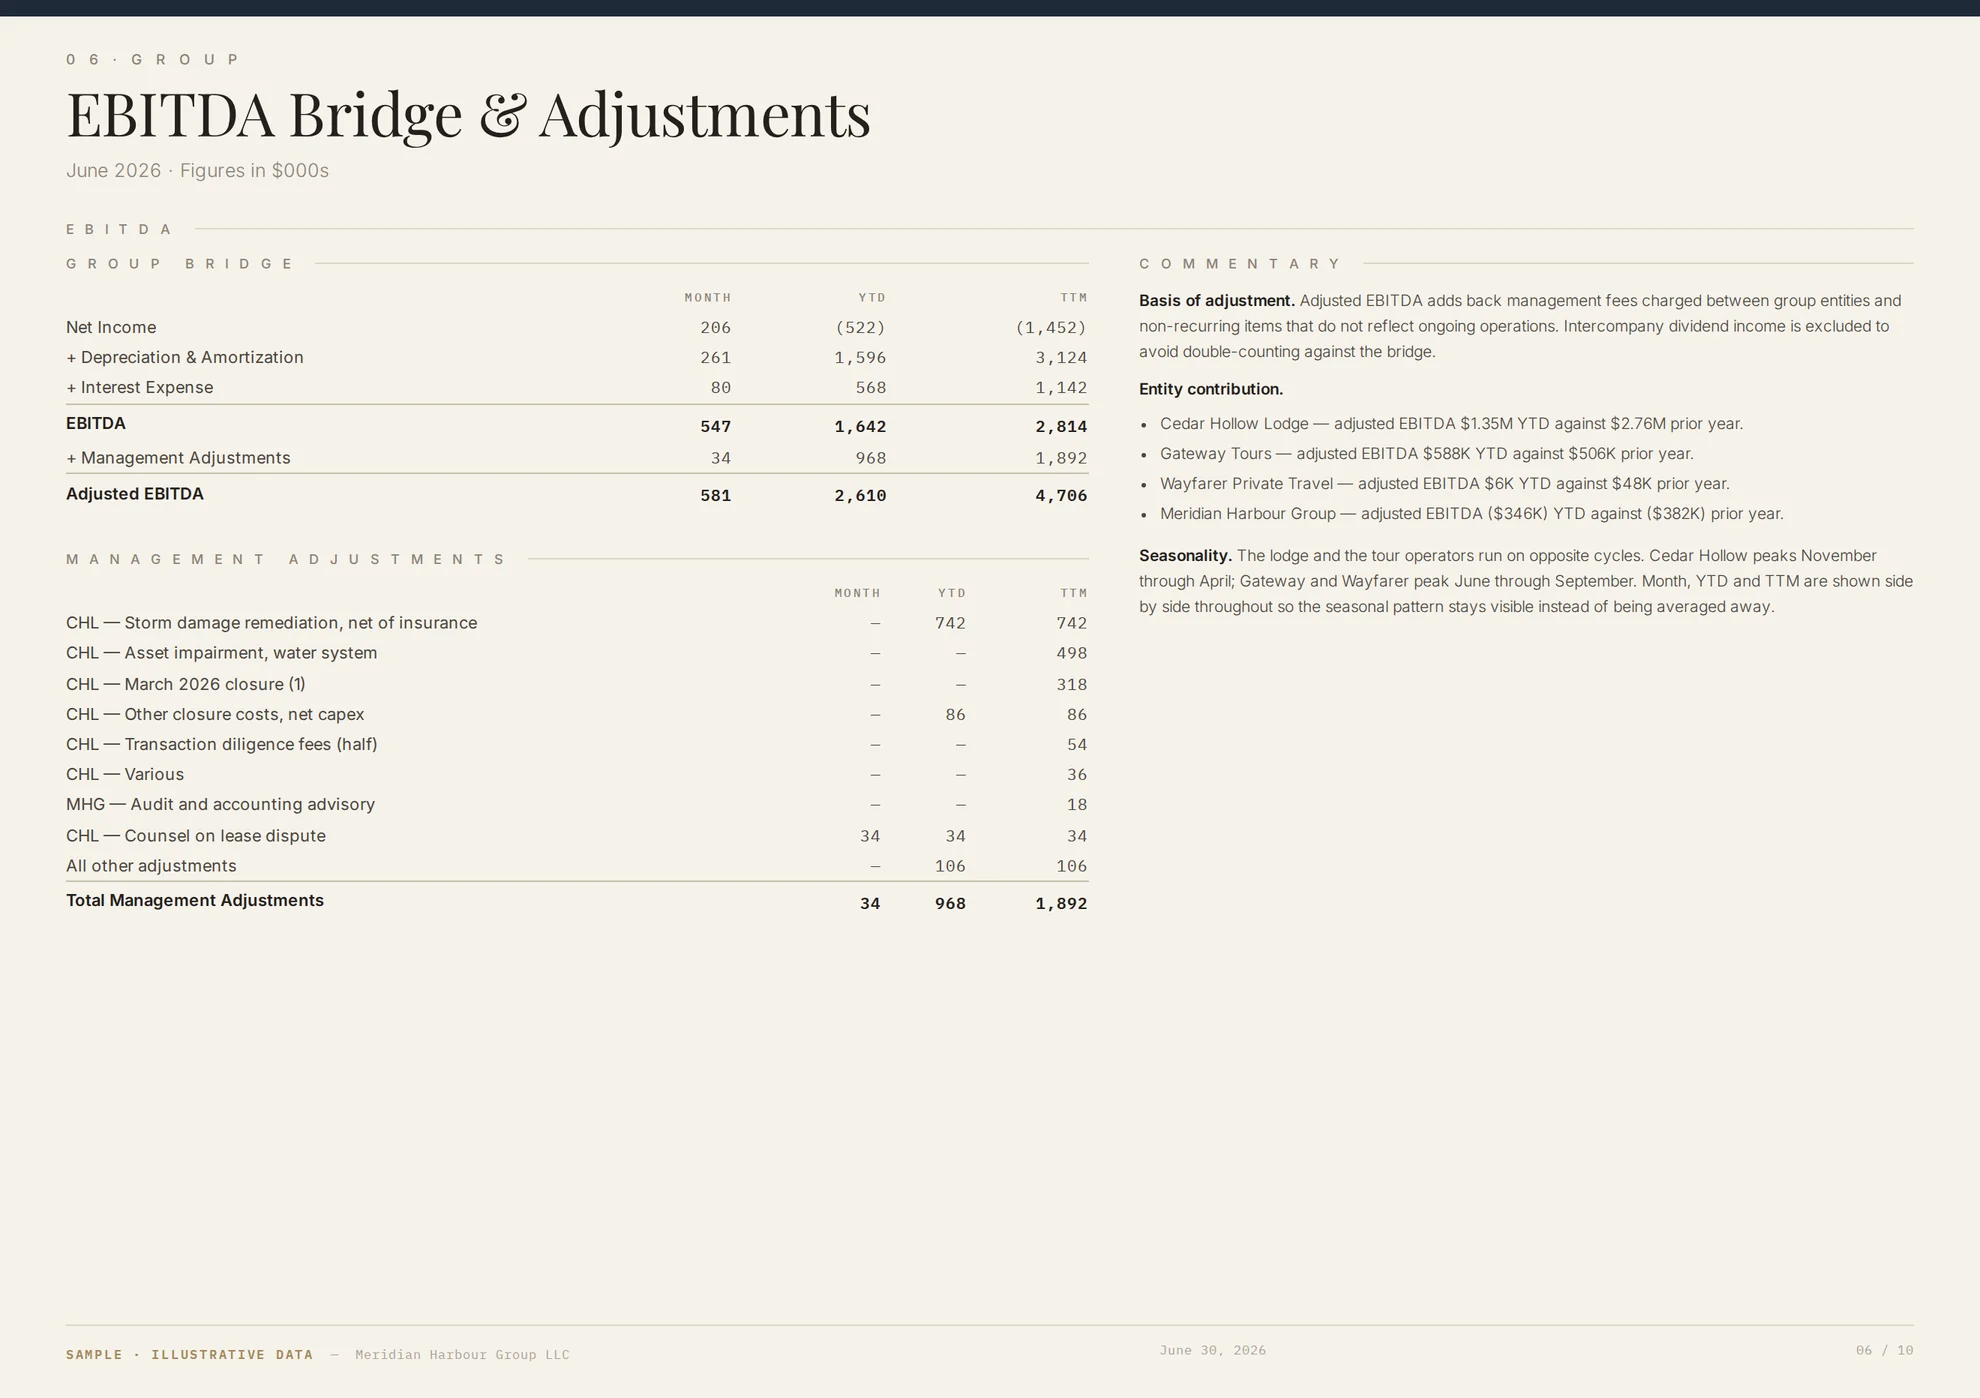
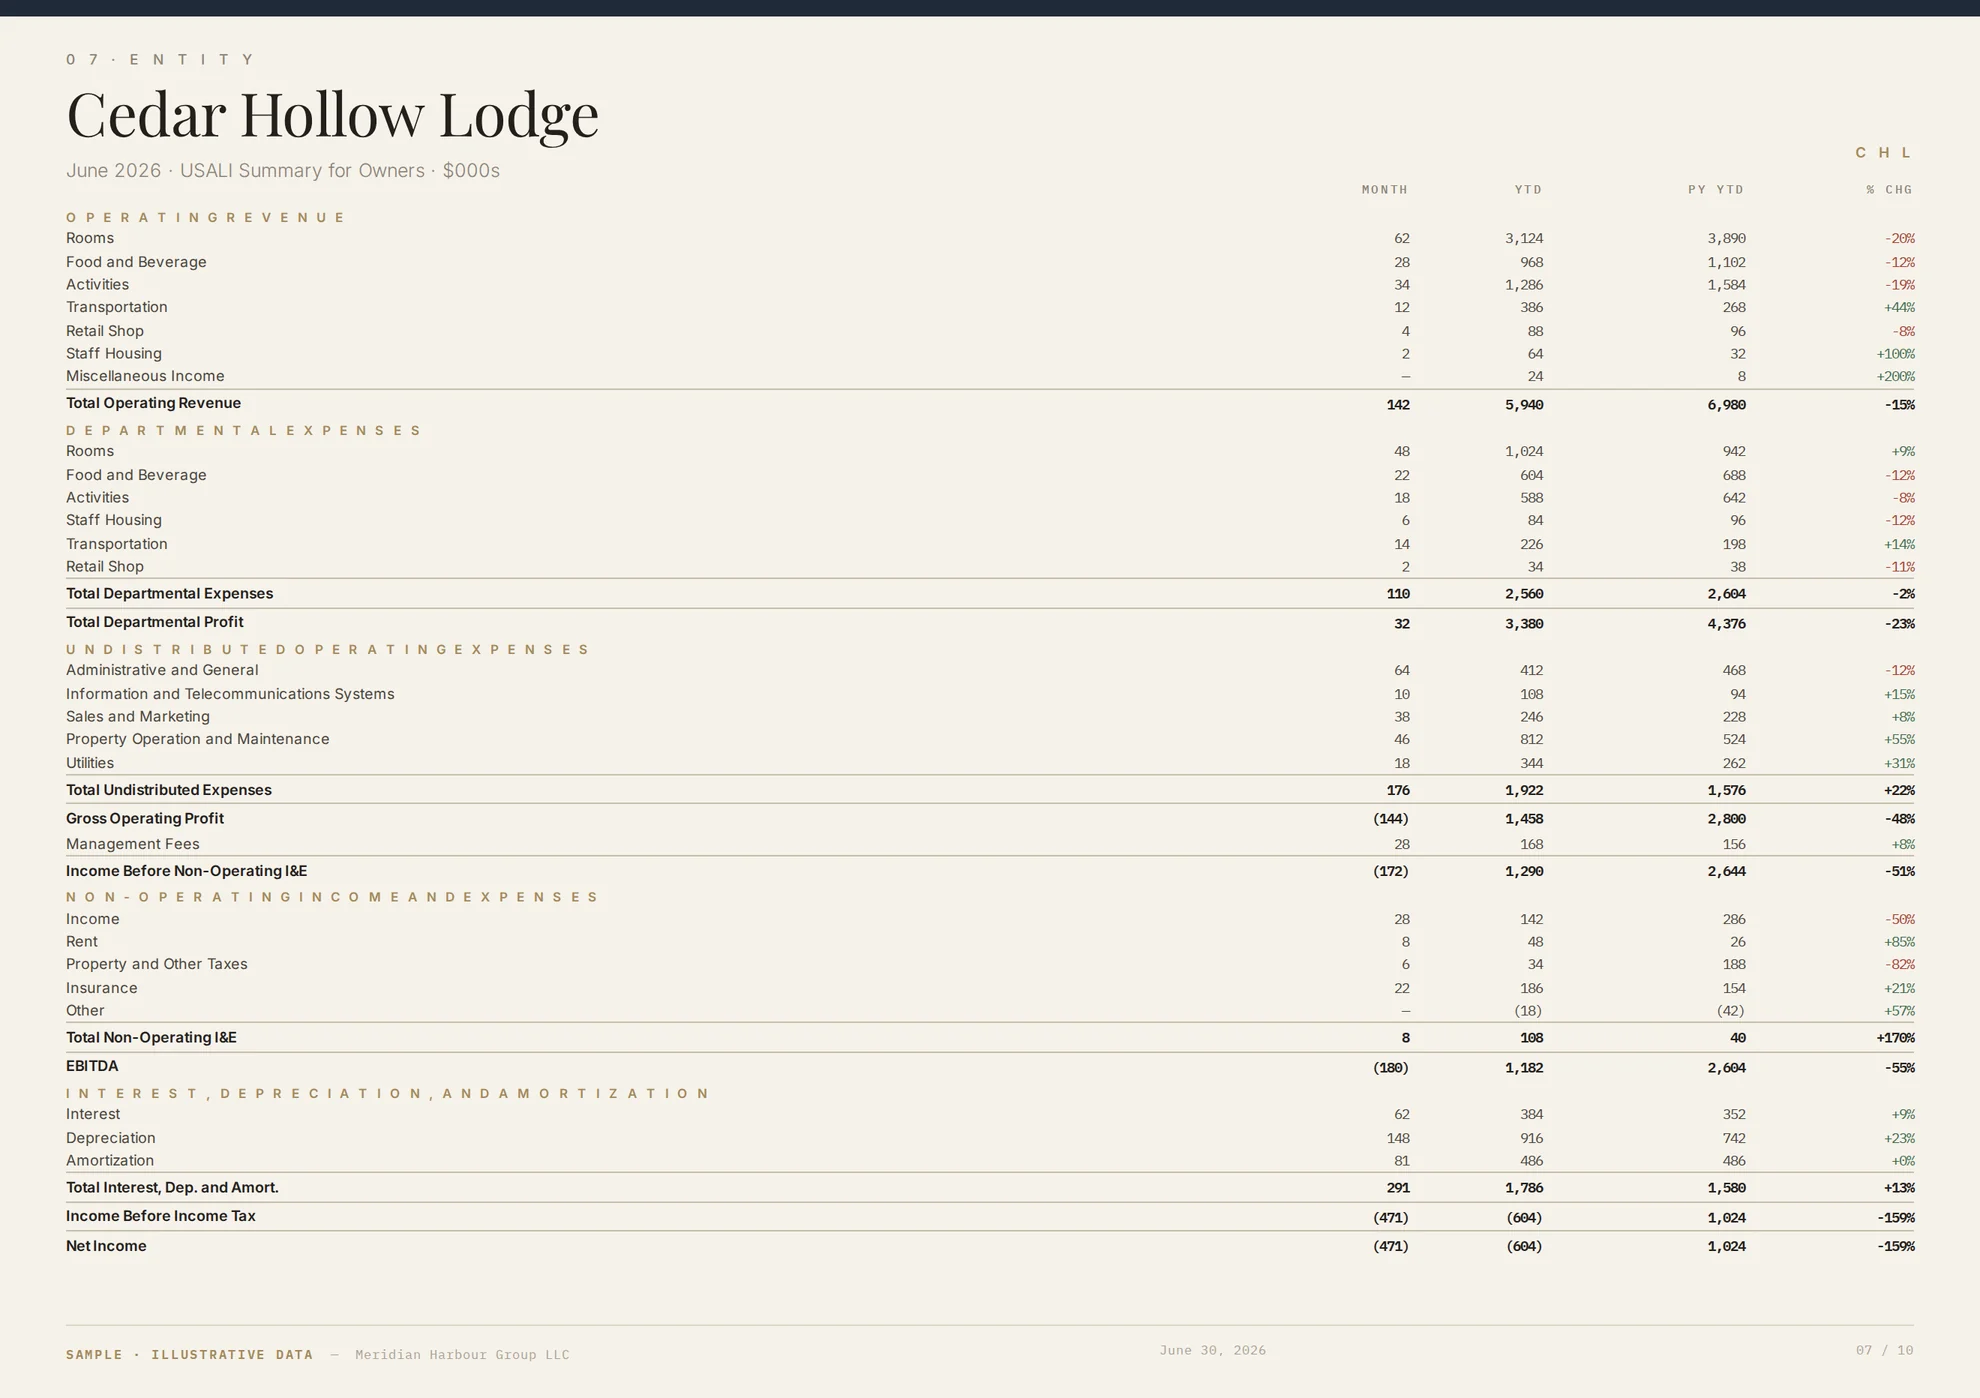
They chose the format. What sits on each page, in what order, and which figures lead came out of what the president and the board said they wanted to look at. The lodge reports in USALI because that is the language its owner and its lender already speak. Month, year to date, and trailing twelve months sit side by side because the entities run on opposite seasons and an average hides it. Management adjustments are broken out line by line because add-backs are what a board argues about. When someone asks for a new cut, it shows up in next month’s deck.
What was broken
Month-end close had become a liability.
Close ran on a 33-tab manual Excel workbook. Every month meant hand-copying five trial balances and reconciling intercompany by hand, hoping nothing broke on the way through. The formula chains had outlived the people who wrote them. There was no audit trail, and restating a prior period meant hours of manual work.
The group ran on three unrelated systems: a specialist reservations platform for tour operations, Xero, and QuickBooks Online across three companies. Each exported a different trial balance format on a different period basis, and no common chart of accounts existed anywhere in the group.
An annual review sat on top of all of it, which meant the fragility had an audience.
The rebuild
Trial-balance-first and append-only, with eliminations stored as auditable data rather than formulas.
Repairing the existing workbook would have preserved the problem, so I rebuilt from source. A normalizer ingests all five trial balance formats, resolves them to a single-month basis, classifies every account against a 43-category common chart of accounts, and writes a flat Fact_Table. The workbook reads that table with pure SUMIFS. No volatile functions, no external links.
It is append-only. Each month adds rows and updates one date cell. Prior periods are never touched. That is what makes forty months of loaded history worth something.
Eliminations are data. Intercompany entries are stored in Fact_Eliminations in journal-entry form, period-stamped, with non-controlling interest handled the same way. Adding a period’s eliminations is an append rather than a formula edit, and a reviewer can read the entries directly.
What made it hard
Most of the work was accounting judgment about data nobody had looked at closely.
parent:child:leaf). The normalizer extracts the leaf code and suppresses parent aggregate rows wherever children are present. Skip that step and every line item double-counts.What it runs today
The build was the beginning of the engagement. Every month the group gets a consolidated statement package, a board deck, and a liquidity and credit report off the same data layer, and the annual review is managed through to completion against those same schedules.
The procedure is documented and two client accountants are being developed against it, which is the part that decides whether any of this survives a change in who is doing the work.